Sunday, January 18, 2015

Supply and Demand

Demand

The quantities that people are willing and able to buy at various prices.
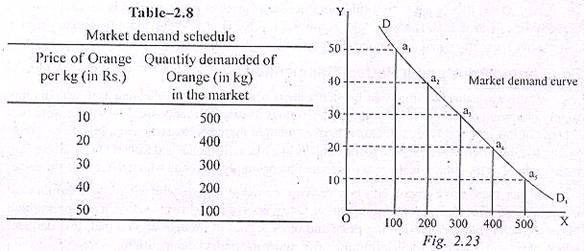
The Law of Demand

An inverse relationship between price and quantity demanded. 


Demand Schedule and Demand Curve

Displays the relationship of Price and Quantity demanded. 


Increase in demand - shift to the right. 
Decrease in demand - shift to the left.

What causes a "change in quantity demanded"? (ΔQD)   Δ in price

What causes a "change in demand"? (ΔD)

1) Δ in buyer's taste (advertising)
2) Δ in the number of buyers (population)
3) Δ in income
    A. Normal goods - goods that buyers buy more of when their income rises. 
    B. Inferior goods - goods that buyers buy less of when their income rises. 
4) Δ in the price of related goods.
    A. Substitute goods - goods that serve roughly the same purpose to buyers. 
                                    ex) Coca Cola and Pepsi
    B. Complimentary goods - goods that are often consumed together. 
                                    ex) Gasoline and automobile, fries and ketchup. 
5) Δ in expectations - thinking about the future. 


Supply

The quantities that producers or sellers are willing and able to produce or sell at various prices.

The Law of Supply

There is a direct relationship between price and quantity supply. (Price increases, quantity increases) 

Supply Schedule and Supply Curve


What causes a "change in supply"? ( ΔQS)       Δ in price

What causes a "change in supply"? ( ΔS) 

1)  Δ in weather
2)  Δ in technology
3)  Δ in taxes or subsidies 
4)  Δ in cost of production
5)  Δ in number of sellers
6)  Δ in expectations


Elasticity of Demand

Elasticity of Demand

Tells how drastically buyers will cut back or increase their demand for a good when the prices rises or falls.

1. Elastic demand

When demand will change greatly given a small change in price.
    -We tend to think of wants.
    Ex) if movie tickets increase to $25, we are lead to find alternate ways.
    More than one

2. Inelastic demand

    Your demand for a product will not change regardless of price.
     We tend to think of needs.
     Ex) Milk, gasoline, medicine, salt
     Less than 1

3. Unielastic demand

    Equal to one

1.New quantity-old quantity/ old quantity
2.New price-old price/ old price
3. PED


Equilibrium

The point at which the supply curve and demand curve intersect. The point that they insect at means that an economy is using their resources efficiently.

Shortage- QD>QS
 Surplus- QS>QD
 

Price ceiling

Government imposed limit on how high you can be charged or service.


Price floor

Government imposed minimum on how low a price can be charged for a service.
                 Ex) $7.25 minimum wage


Total Revenue- Price x Quantity 

Marginal Revenue

Additional income from selling an additional unit of a good.


Fixed cost

A cost that does not change no matter how much is produced.
Ex) rent, mortgage

Variable cost

A cost that changes and fluctuates.
Ex) water bill (how much you use)

Marginal cost- New total cost - old total cost

Spend the cost, revenue is what you bring in.

Total cost- TFC+TVC=TC

Average total fixed cost- AFC + AVC

Average Fixed Cost- TFC/Quantity

Average Variable Cost- TVC/Quantity

Total Variable Cost- Quantity x AVC


Wednesday, January 14, 2015

Production Possibilities

1. Macroeconomics vs. Microeconomics

Macroeconomics 
The study of major components of the economy
Ex) inflation, GDP, international trade

Microeconomics
Study of how households and firms make decisions and how the interact in markets.

2. Positive economics vs. Normative Economics

Positive economics
Claims that attempt to describe the world as is. Very descriptive
Ex) Minimum wage laws causes unemployment.

Normative economics
Claims that attempt to prescribe how the world should be. Very prescriptive in nature. Opinion based.
Ex) the government Should raise minimum wage.

3. Needs Vs. Wants

Needs
Basic requirements for survival

Wants
The desires of citizens. They are more broader than your needs.

Scarcity vs. Shortage

Scarcity
It is the most fundamental economic problem facing all societies. Saturating unlimited wants with limited resources.
Ex) Gold, oil

Shortage 
Where quantity demanded is greater than quantity supplied. Shortages are temporary whereas scarcity is a permanent problem.


4. Goods vs. Services

Goods
Tangible commodities
Consumer goods- goods that are intended for final use by the consumer.
Ex) chocolate candy bar, car

Capital goods
Items used in the creation of other goods
Ex) factory machinery and trucks

Services
Work that is performed for someone else


5. Factors of production

1) Land- natural resources
2) Labor- work force
3) Capital- 2 types
Human capital- knowledge and skills, what you gain from education and experience.
Physical capital- human made objects used to create other goods and services.
4) Entrepreneurship- you must be an innovator and a risk taker.


How do we use our resources effectively?


Trade offs 
Alternatives that we give up whenever we choose one course of action over another.
Ex) we choose as students to either go to school or stay in bed. Should I study or should I hang out with friends?

Opportunity cost 
It is the most desirable alternative given up by making a decision.

Production possibilities graph
Shows alternative ways to use resources

The line represents the PPC, Production Possibility Curve, or also known as the PPF, Production Possibilities Frontier. Each point shows a trade off.

In this example we are able to see that:

Point A- This point represents under-utilization.
               It is attainable but inefficient.
               To get to this point, you can have a decrease in population, a recession, war and famine, and either underemployment or unemployment.

Point B- This point is considered efficient but more guns are produced that than butter.

Point C- This point is considered efficient but more butter is produced than guns.

Point D- This point is efficient, and both guns and butter are produced equally.

Point X- This point is on the outside of the curve and is considered unattainable. This point in production can be caused by an economic growth, technology, or new resources.


Productive efficiency
Producing at the lowest cost, allocating resources efficiently, and having full employment of resources. Any point on the curve.

Allocative efficiency 
Looking at where to produce on the curve. Looking for the best combination possible.